CHEMISTRY

JAMB 2002 - Question 8

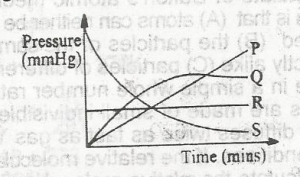
Chemistry 2002 JAMB Past Questions - Question 8: In the diagram above, the curve that represents the production of oxygen gas from the decomposition of KCLO3 in the presence of MnO2 catalyst is

Use the diagram to answer question that follows
In the diagram above, the curve that represents the production of oxygen gas from the decomposition of KCLO3 in the presence of MnO2 catalyst is
A:
B:
C:
D:
Examkits App

Examkit's JAMB CBT App

Practice JAMB offline with our Online, PC and Mobile App

  • ✅ 25+ years of past questions (2000 to 2025)
  • ✅ Video solutions and explanation to questions
  • ✅ E-library
  • ✅ Study by topic
  • ✅ And more.

Correct Answer

B

Explanation