
MATHEMATICS
JAMB 2013 - Question 41
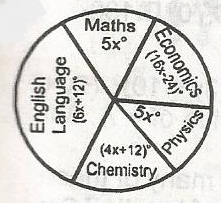
Mathematics 2013 JAMB Past Questions - Question 41: The pie chart above shows the statistical distribution of 80 students in five subject in an examination .Calculate how many students offer Mathematics .

Correct Answer
A
Explanation
5x + (16x -24) +5x + (4x +12) + (6x + 12) + (6x +12) = 36036x - 24 + 12 + 12 = 36036x = 360x = 360 /36 = 10Thus, the angle of sector representing mathematics is 5 x 10 = 50 Hence the number of students who suffer mathematics is50/360 x 80 ~ 11 No answer in the option To determine the number of students who offer Mathematics based on the given pie chart, we need to find the percentage of the pie chart that represents the Mathematics subject and then calculate that percentage of the total number of students.Let's assume that the percentage of the pie chart representing Mathematics is 'x'.Since the pie chart represents 100% of the students, we can set up the following equation:x% of 80 = x/100 * 80To find the value of 'x', we need to know the specific percentage of the pie chart that represents Mathematics. If that information is provided, we can substitute it into the equation and solve for 'x'.